ShmoopTube
Where Monty Python meets your 10th grade teacher.
Search Thousands of Shmoop Videos
PSAT Videos 97 videos
PSAT 1.1 Math Diagnostic. If a rabbit consumes 3 meals a day, how many grams of food will a rabbit consume in 7 days?
PSAT 1.12 Math Diagnostic 185 Views
Share It!
Description:
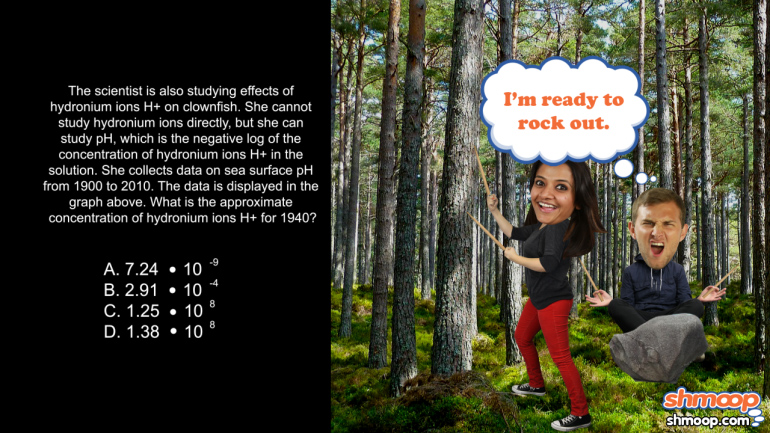
PSAT 1.12 Math Diagnostic. Which of the following graphs best models the relationship between anemone toxicity x and the number of clownfish y?
More Video DetailsTranscript
- 00:00
Thank you We sneak And here's your smoke too Sure
- 00:06
brought to you by clown fish along with sea lions
- 00:09
and tiger sharks they're always a big draw An underwater
- 00:12
circus that all right check out this info Scientists about
- 00:17
the clown features are home their toxicity and enemies being
Full Transcript
- 00:19
the most talked about me All right Which of the
- 00:24
following graphs best models the relationship between a gn enemy
- 00:28
toxicity x and the number of clown fish Why And
- 00:33
here the pencil answer All right who doesn't choose their
- 00:38
home based on the an enemy toxicity Back when our
- 00:41
realtor was helping us get a new pad that was
- 00:44
one of the main things we looked for A quiet
- 00:46
neighborhood good schools and good and enemy toxicity Hey it
- 00:49
wasn't our first rodeo All right This one is simple
- 00:53
enough information wise when the an enemy had a toxicity
- 00:56
of one or nine In other words on the very
- 00:58
high end or the very low in the clown fish
- 01:01
population wasn't very high at toxicity levels of three and
- 01:06
seven So a little bit higher than the lowest lows
- 01:09
and a little bit lower than the highest of highs
- 01:11
A few more clownfish had set up shop but a
- 01:15
toxicity level of five smack dab in the middle It
- 01:18
was an absolute clown Fish haven apparently that's their hamptons
- 01:23
The question is which of these four graphs best represents
- 01:27
this relationship of clownfish to a gn enemy toxicity Well
- 01:32
since five is the prime toxicity level and the clown
- 01:35
fish population falls on either side of that number That's
- 01:39
going to need to be the vertex of our cur
- 01:42
Since the clown fish population drops off the further below
- 01:46
or above that number we go The graph should also
- 01:49
drop off on both sides from that point Well graft
- 01:53
b doesn't have the right vertex that uses the point
- 01:55
three too So we can rule that one out right
- 01:57
away and graphs See the vertex of five is a
- 02:00
minimum not a maximum indicating that this is where you
- 02:03
find the fewest clown fish with no for a fact
- 02:06
is other hug walk He was apparently blindfolded and turned
- 02:10
around a few times because well it's totally disoriented there's
- 02:13
No maximum representative x equals five So we can nix
- 02:16
thea's Well well the award for graph of our dreams
- 02:19
goes the option a which has a vertex of the
- 02:22
appropriate spot and demonstrates that the clown fish population decreases
- 02:27
the further away you get from that number So if
- 02:29
you're ever passing through a potential clownfish neighborhood and you
- 02:32
don't particularly care for the cut of their jib well 00:02:35.83 --> [endTime] you know where to hang Out
Related Videos
PSAT 1.1 Reading Diagnostic. The main purpose of the first two paragraphs is to...what?
PSAT 2.2 Reading Diagnostic. What is the main rhetorical effect of this phrase in the second paragraph?
Writing Diagnostic. To make the paragraph most logical, sentence 2 in the second paragraph should be placed...where?
PSAT 1.4 Writing Diagnostic. Which choice most effectively combines the two sentences in the underlined portion?
PSAT 1.5 Writing Diagnostic. How should the underlined portion be changed in the passage, if at all?
