ShmoopTube
Where Monty Python meets your 10th grade teacher.
Search Thousands of Shmoop Videos
Statistics and Probability Videos 134 videos
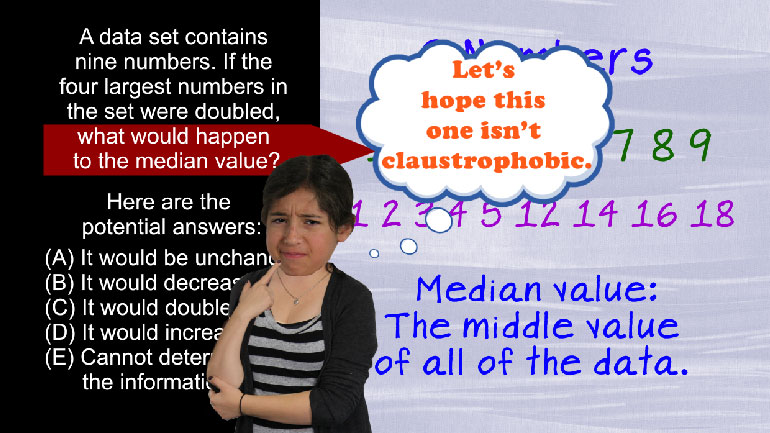
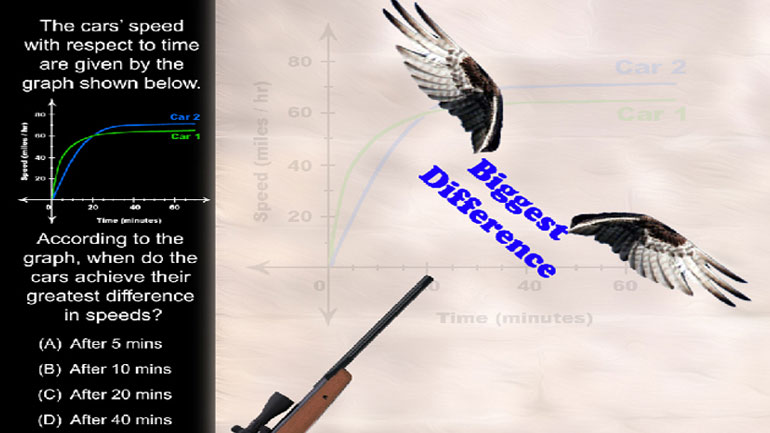
SAT Math: Statistics and Probability Drill 1, Problem 2. If the four largest numbers in the set were doubled, what would happen to the median...
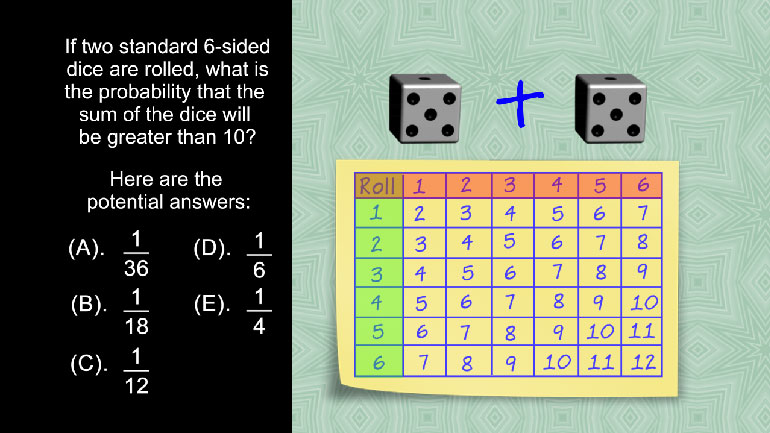
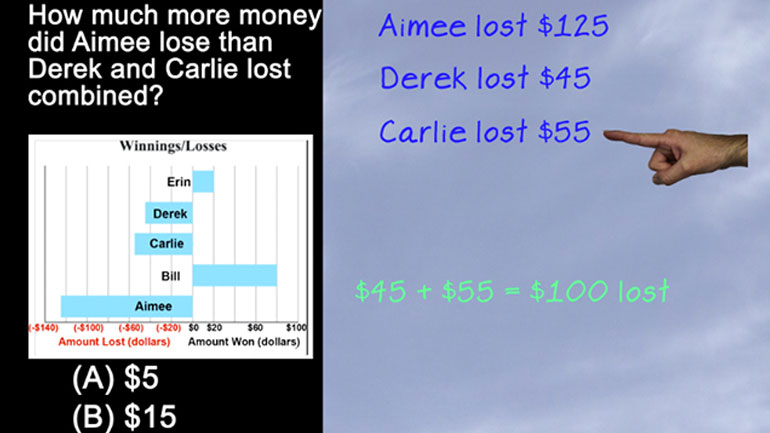
SAT Math 1.4 Statistics and Probability. If two standard 6-sided dice are rolled, what is the probability that the sum of the dice will be gre...
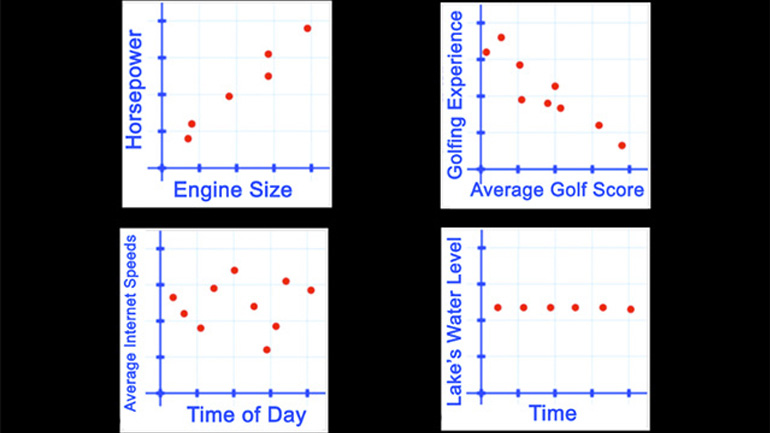
SAT Math 1.5 Statistics and Probability. If Silas draws one card, then places it in his pocket and draws another, what is the probability that...
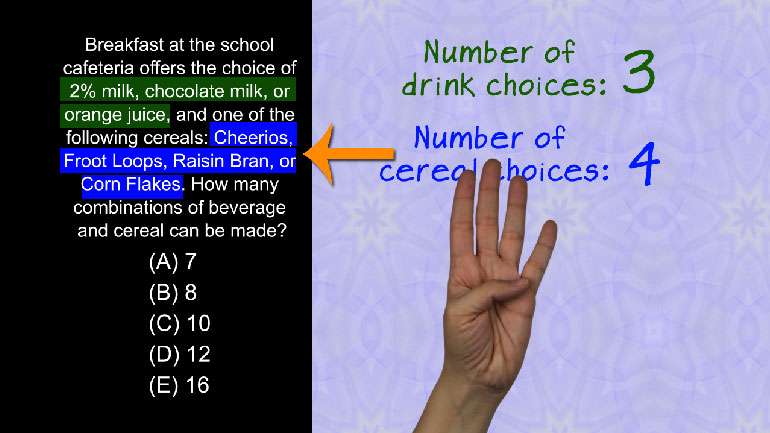
CAHSEE Math 6.3 Statistics, Data, and Probability II 182 Views
Share It!
Description:
Statistics, Data, and Probability II: Drill Set 6, Problem 3. Based on the graph, what can be said about a student with a 2.5 GPA?
Transcript
- 00:03
Here’s an unshmoopy question you’ll find on an exam somewhere in life.
- 00:07
Twenty students who have driver's licenses were asked about the number of tickets and/or
- 00:11
accidents that they have had and their grade point averages.
- 00:14
Don’t worry – we made sure not to conduct the survey while they were driving.
- 00:18
The results of the poll are shown in the following graph.
Full Transcript
- 00:21
Based on this graph, what can be said about a student with a 2.5 GPA?
- 00:27
Other than that… they would probably have a tough time interpreting this graph?
- 00:31
And here are the potential answers...
- 00:36
Okay, we’re given a precise spot on the
- 00:38
graph to look at, so let’s… look at it.
- 00:41
We want to see what can be deduced about a student with a 2.5 GPA.
- 00:46
If we look at the 2.5 line on the graph,
- 00:49
we can see that there are students with 0, 1 or 3 tickets.
- 00:52
And because there doesn’t seem to be much rhyme or reason to the points on this scatter plot...
- 00:59
…there could just as easily be a student with 2, 4 or 300 tickets.
- 01:04
Which brings us to the conclusion that… we can’t come to a conclusion.
- 01:07
Since there are no patterns in this graph, we really can’t know ANYTHING about a student
- 01:11
with a particular GPA.
- 01:16
Which leads us to answer D – Nothing can be deduced about that student’s driving record.
- 01:21
That is, GPA and driving are not correlated.
- 01:24
As in, “Don’t take your eyes off the road…’
Related Videos
SAT Math: Statistics and Probability Drill 1, Problem 2. If the four largest numbers in the set were doubled, what would happen to the median...
SAT Math 1.4 Statistics and Probability. If two standard 6-sided dice are rolled, what is the probability that the sum of the dice will be gre...
SAT Math 1.5 Statistics and Probability. If Silas draws one card, then places it in his pocket and draws another, what is the probability that...
CAHSEE Math: Algebra and Functions Drill 5, Problem 3. Solve the equation.
