ShmoopTube
Where Monty Python meets your 10th grade teacher.
Search Thousands of Shmoop Videos
Statistics and Probability Videos 134 videos
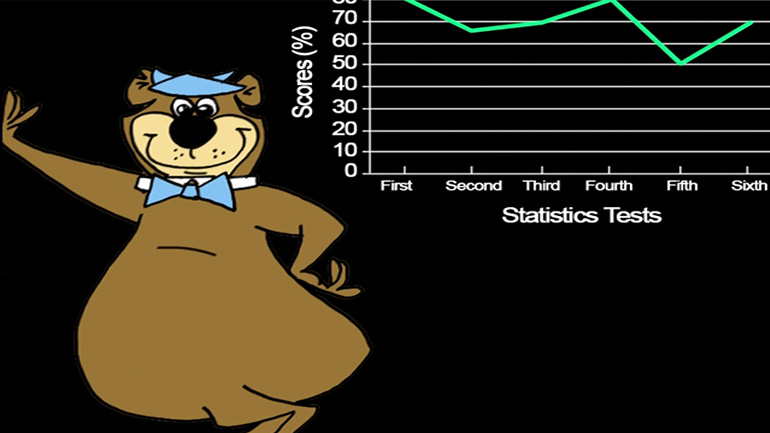
SAT Math: Statistics and Probability Drill 1, Problem 2. If the four largest numbers in the set were doubled, what would happen to the median...
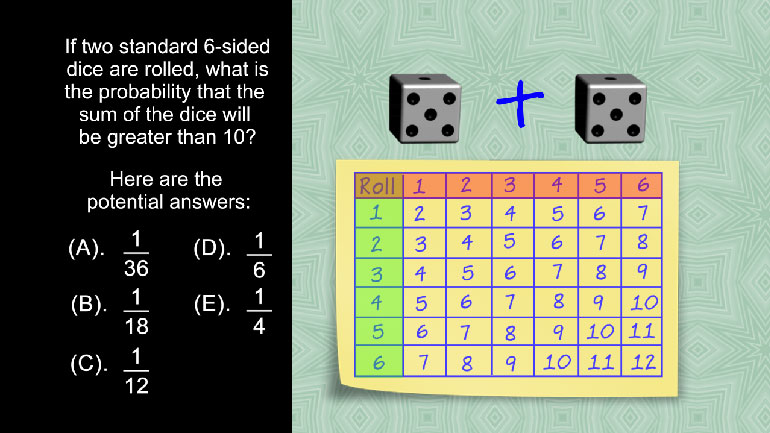
SAT Math 1.4 Statistics and Probability. If two standard 6-sided dice are rolled, what is the probability that the sum of the dice will be gre...
SAT Math 1.5 Statistics and Probability. If Silas draws one card, then places it in his pocket and draws another, what is the probability that...
CAHSEE Math 4.3 Mathematical Reasoning 180 Views
Share It!
Description:
Mathematical Reasoning Drill 4, Problem 3. For approximately how long did the pie remain higher than the three-story building?
Transcript
- 00:03
And here's your shmoop du jour...
- 00:05
The following graph shows the relationship between the height (in feet) of a cream pie that
- 00:09
a clown threw from the ground with an initial velocity of 48 feet per second, and the time (in seconds).
- 00:15
It is estimated that the height of a one-story building is 10 feet.
- 00:20
For approximately how long did the pie remain higher than the three-story building?
Full Transcript
- 00:24
And here are the potential answers…
- 00:28
The question asks roughly how long the object was higher than a three-story building.
- 00:32
It also tells us that the height of one story is 10 feet.
- 00:36
We can multiply 10 by 3, since we want a three-story building,
- 00:40
to get that a three-story building that is thirty feet high.
- 00:43
So, we want to figure out how long the pie was at least thirty feet high.
- 00:48
To do this, we need to figure out about where thirty feet is on our graph.
- 00:52
The graph shows the height of the pie in terms of time, which is perfect for us, since we
- 00:56
want to figure out how long the object was above thirty feet.
- 01:01
In other words, if we draw a line at y equals thirty feet, we want to figure out how long
- 01:05
the parabola is above the line.
- 01:08
We can see that on the y-axis, 24.188 and 36.281 are marked.
- 01:13
Since the question asks us for the answer approximately,
- 01:16
we can round a little bit and consider those as 24 and 36.
- 01:21
Luckily for us, 30 is exactly in between 24 and 36, which means that
- 01:25
the line between the two is roughly thirty feet.
- 01:28
Now all we have to do is find where the curve has a y-value greater than thirty.
- 01:33
We can see that it intersects the line we’ve designated as about thirty a little before
- 01:37
one second on its way up…
- 01:39
…and it intersects the line a little past two on its way down.
- 01:43
This comes out to covering a distance on the x-axis that’s a little more than one second,
- 01:47
but probably less than a second and a half.
- 01:51
The only answer that fits that criterion is (B), 1.2 seconds.
- 01:55
As in, “Boink!”
Related Videos
CAHSEE Math: Algebra and Functions Drill 5, Problem 3. Solve the equation.
The video will show you how to plot points in 3D using the axes of the 3D coordinate system. Make sure you're wearing your special glasses for this...
When graphing inequalities, you graph the line, shade the corresponding side, and plug in the point. The end!
One formula to rule them all, one formula to find them. One formula to bring them all, and in the darkness bind them. Or something like that. I...
