ShmoopTube
Where Monty Python meets your 10th grade teacher.
Search Thousands of Shmoop Videos
Exploring Data Videos 25 videos
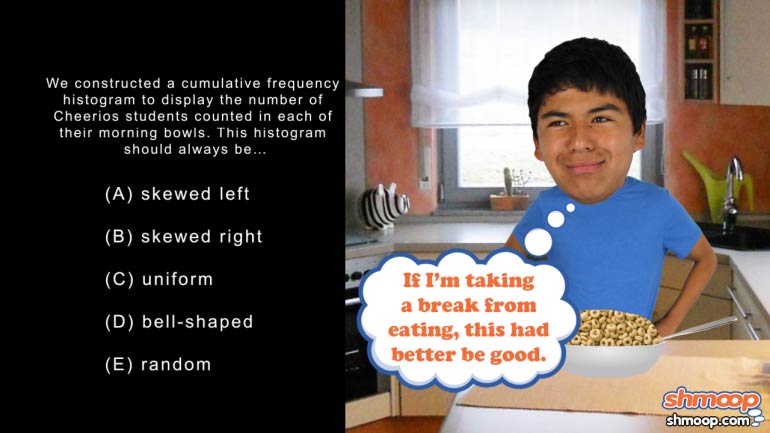
AP Statistics: Exploring Data Drill 1, Problem 2. Which of the following is the best way to display this type of data?
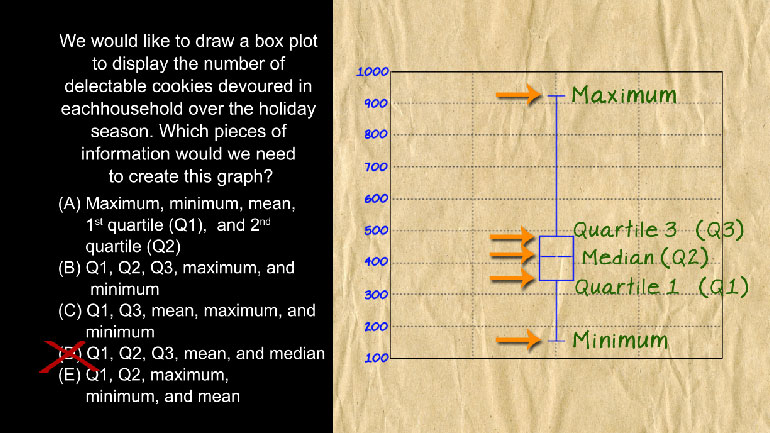
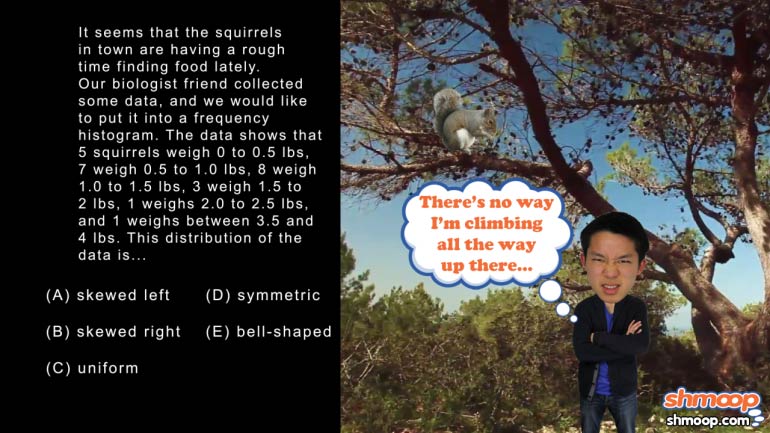
AP Statistics: Exploring Data Drill 1, Problem 5. Which pieces of information would we need to create this graph?
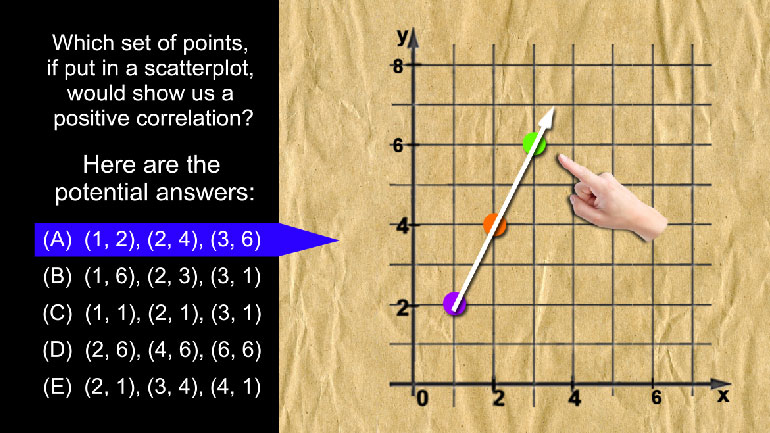
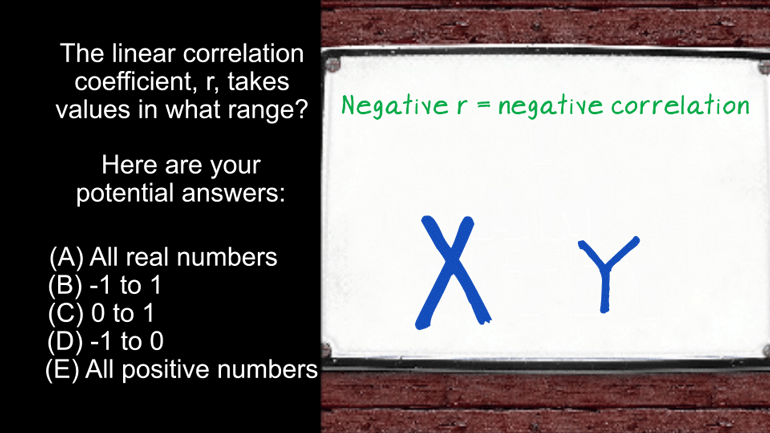
AP Statistics: Exploring Data Drill 2, Problem 3. Which set of points, if put in a scatterplot, would show us a positive correlation?
AP Statistics 4.1 Exploring Data 196 Views
Share It!
Description:
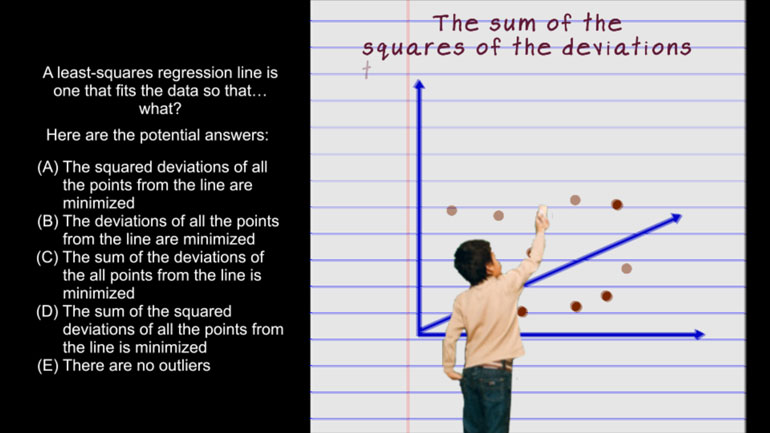
AP Statistics 4.1 Exploring Data. A least-squares regression line is one that fits the data so that...what?
Transcript
- 00:00
Thank you We sneak and here's your shmoop toos your
- 00:05
brought to you by least squares which is a really
- 00:08
depressing outcome If you're playing a fellow a least squares
- 00:13
regression line is one that fits the data so that
- 00:17
what And here the pendulum Already So we've basically got
Full Transcript
- 00:23
another definition video on our hands here least squares regression
- 00:28
What is it Why do we need it And well
- 00:30
who really cares Well some of us do believe anyway
- 00:33
this question just wants to know if we understand the
- 00:36
point of the least squares regression well we always want
- 00:40
the sum of the squares of the deviations to be
- 00:42
a small as possible so that the line describing that
- 00:45
data representatives is close to perfect as we can get
- 00:48
it least squares regression line is intended to do just
- 00:52
that to minimize the sum of the square deviations and
- 00:55
by doing so provide a best pit summary of the
- 00:57
relationship between our two variables It's something like a tailor
- 01:01
in that respect except it doesn't have to go around
- 01:03
measuring the deviations in scenes or so yeah this is
- 01:08
kind of one of those either you know or you
- 01:10
don't problems And in this case if you know it
- 01:12
you'll pick and through deep This is one of the
- 01:14
few times we fully endorsed regressing long as it's here 00:01:18.972 --> [endTime] and not in the playground
Related Videos
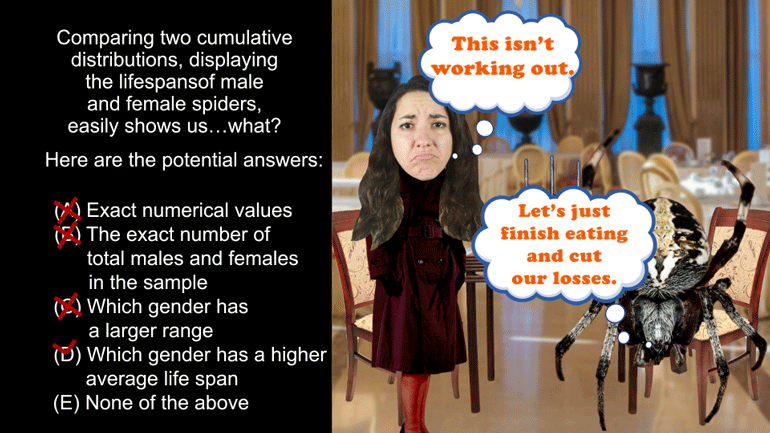
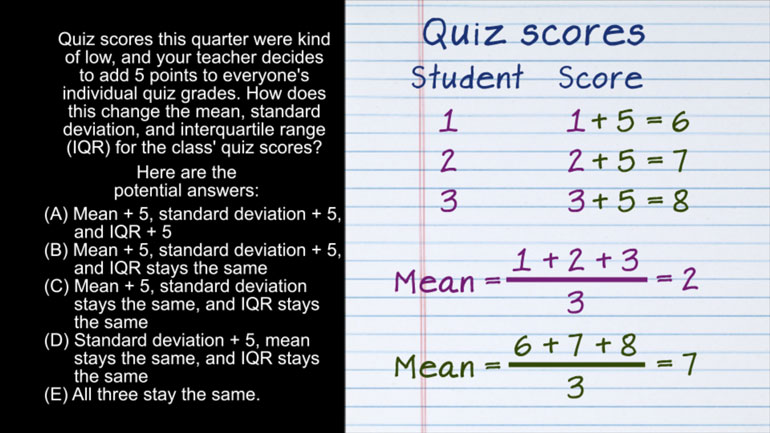
AP Statistics 2.1 Exploring Data. How does this change affect the mean, standard deviation, and IQR?
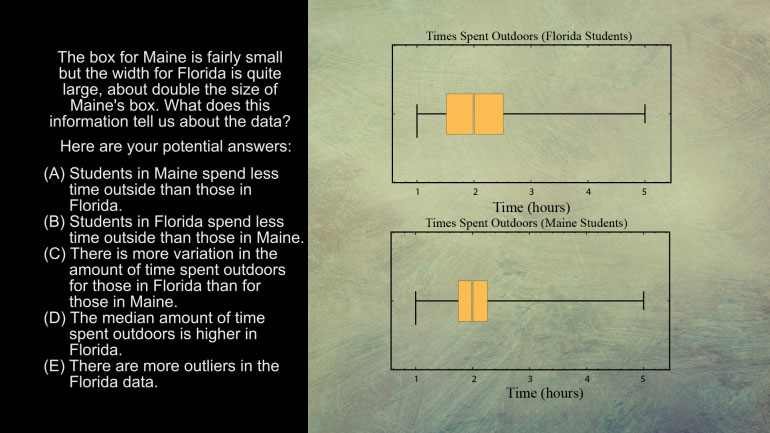
AP Statistics 5.1 Exploring Data. What does this information tell us about the data?
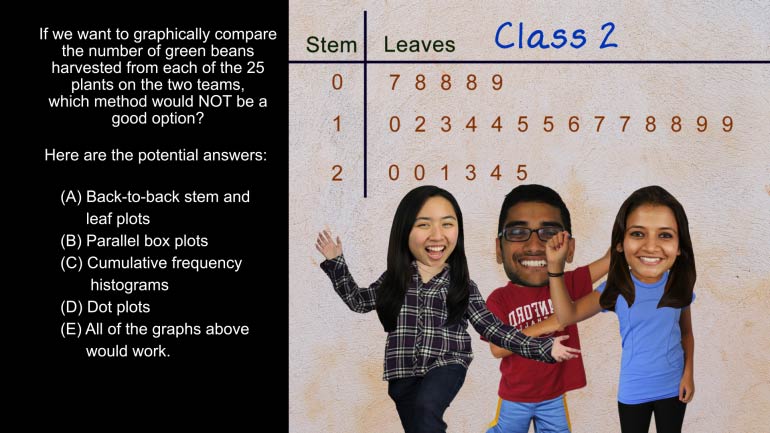
AP Statistics 5.2 Exploring Data. Which method would not be a good option?
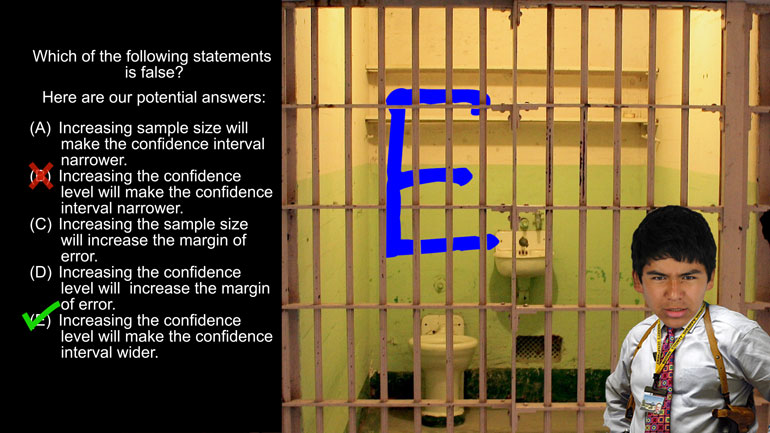
AP Statistics 1.5 Statistical Inference. Which of the following statements is false?
Want to pull an Oliver Twist and ask us for more? We've gotcha covered. Head over to /video/subjects/math/test-prep/ap-statistics/ for more AP...
