ShmoopTube
Where Monty Python meets your 10th grade teacher.
Search Thousands of Shmoop Videos
Playlist ACT® Science Data Representation 25 videos
ACT Science: Data Representation Passage Drill 1, Problem 1. What do the statistics in Figure 1 suggest?
ACT Science: Data Representation Passage Drill 1, Problem 2. Which of the following is a variable in Figure 1, but not in Figure 2?
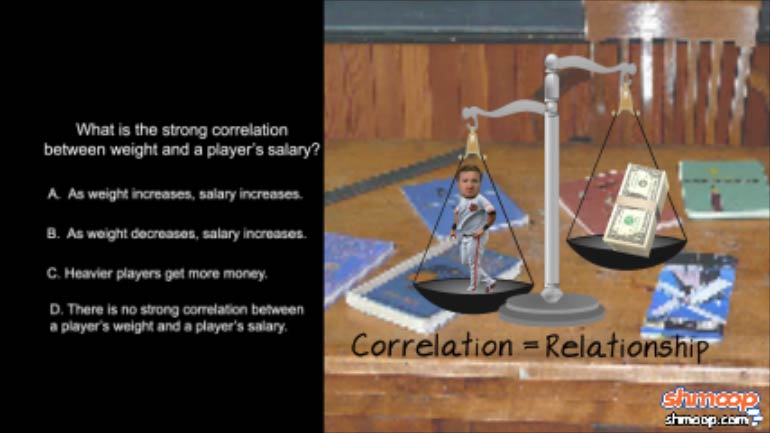
ACT Science: Data Representation Passage Drill 1, Problem 3. What is the strong correlation between weight and a player's salary?
ACT Science 2.9 Data Representation Passage 196 Views
Share It!
Description:
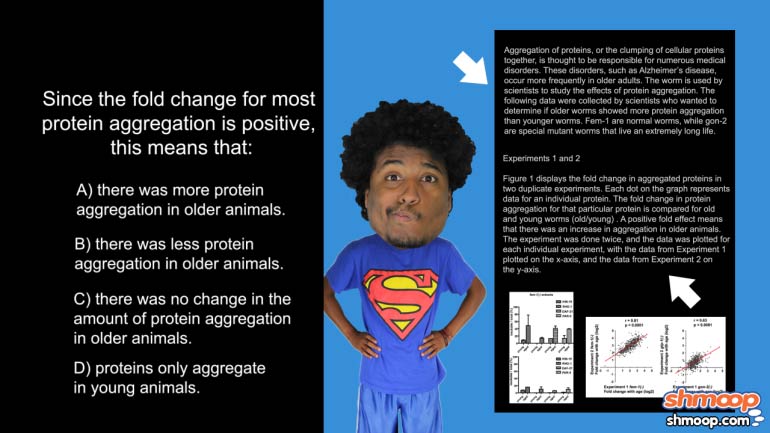
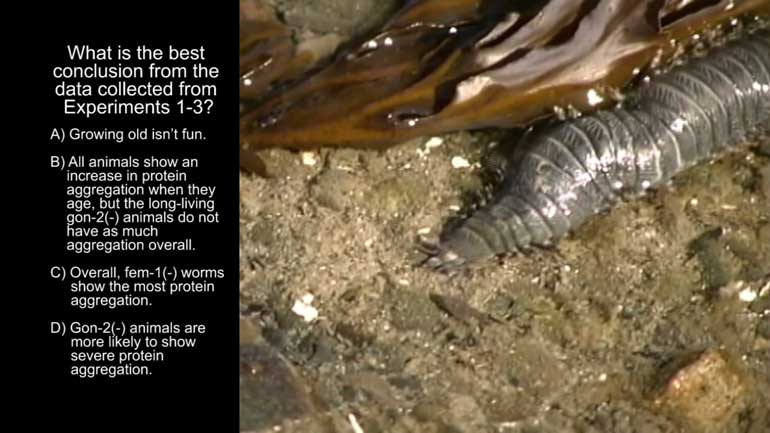
ACT Science: Data Representation Passage Drill 2, Problem 9. What is the best conclusion from the data collected from Experiments 1-3?
Transcript
- 00:04
Here's your shmoop du jour, brought to you by proteins.
- 00:07
They're just amateur teens who now get paid for...what they do.
- 00:26
All right -- what is the best conclusion from the data collected from Experiments 1-3?
- 00:30
And here are the potential answers...
- 00:36
This question asks for the take-home message of the graphs.
Full Transcript
- 00:39
What's it asking?
- 00:40
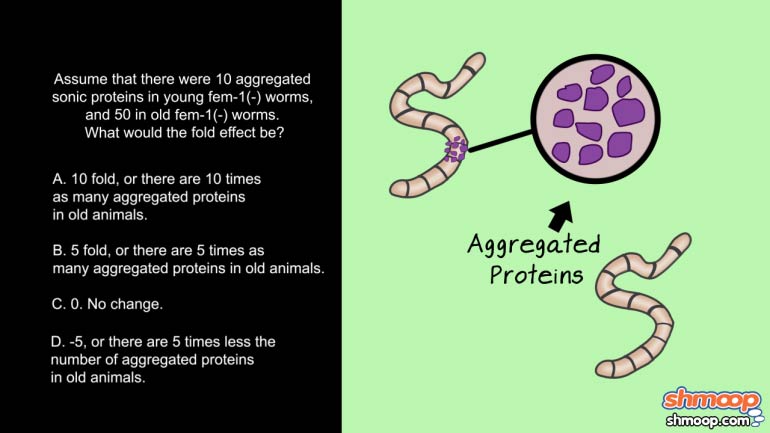
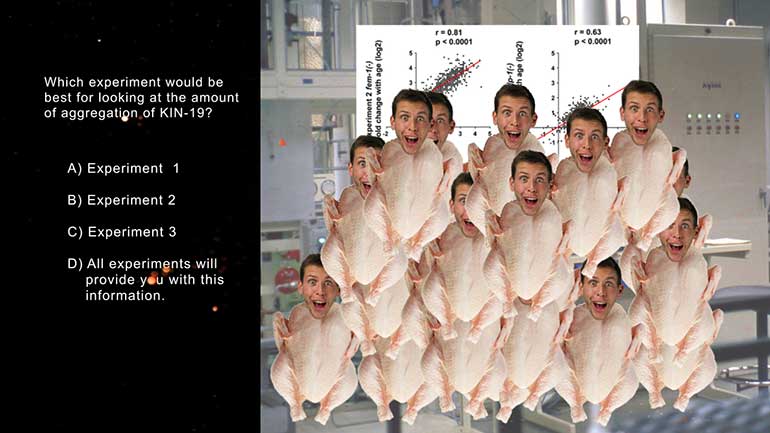
Experiments 1 and 2 show that most proteins have a higher amount of aggregation in older
- 00:45
animals, hence the increase in fold effect, as shown by the graphs.
- 00:49
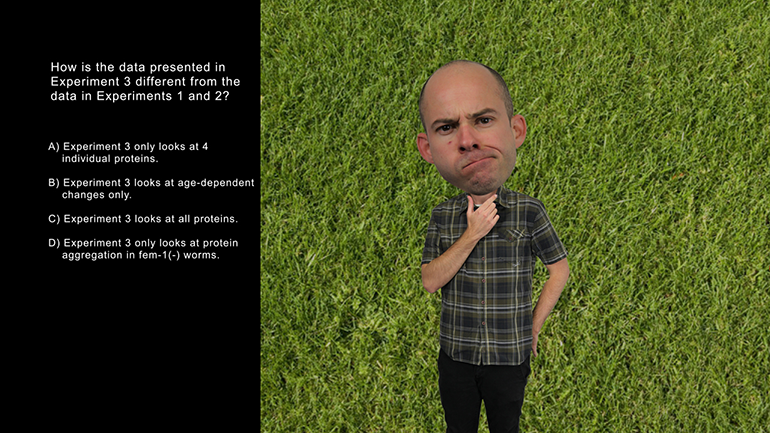
Experiment 3 looks at four specific proteins and comes to the same conclusion.
- 00:53
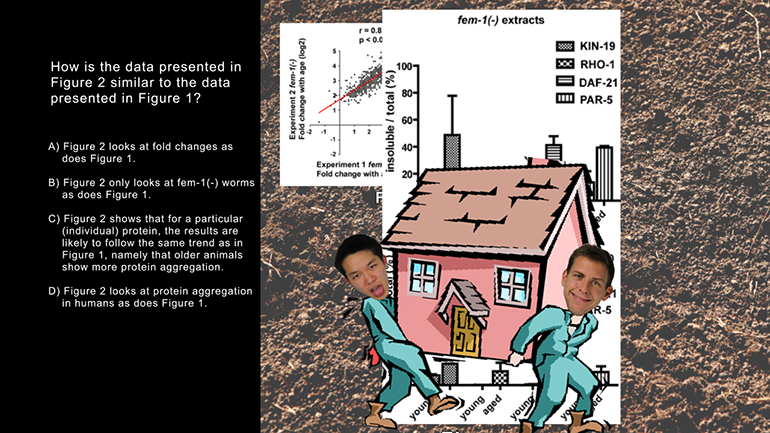
The first graph in figure 2 shows a large difference between young and aged worm insoluble
- 00:59
protein aggregation. Mmm, doesn't that sound delicious? That's McDo—uh, never mind.
- 01:03
...which shows that fem worms...these things...have a large amount of aggregation as they get older.
- 01:08
However, the second graph in figure 2 shows that the amount of aggregation is less in
- 01:12
aged gon-2 animals...
- 01:15
...the special mutant worms that live extremely long lives. Wish we could clone those...
- 01:20
* Therefore the correct answer is B -- all animals show an increase in protein aggregation
- 01:23
when they age, but the long-living gon-2 animals do not have as much aggregation overall.
- 01:28
Oh, well, guys. You tried.
Related Videos
ACT Science: Research Summary Passage Drill 2, Problem 1. Why do you think that the filter paper will not remove the salt from the water?
ACT Science: Conflicting Viewpoint Passage Drill 1, Problem 1. What statement would both scientists agree upon?
ACT Science: Data Representation Passage Drill 1, Problem 1. What do the statistics in Figure 1 suggest?
ACT Science: Data Representation Passage Drill 1, Problem 2. Which of the following is a variable in Figure 1, but not in Figure 2?
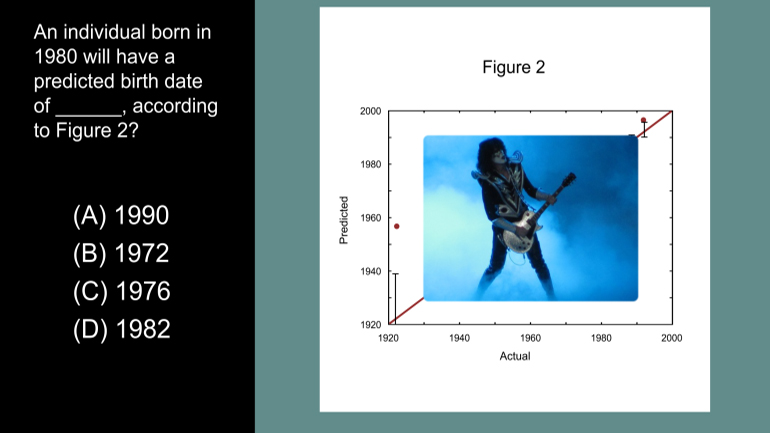
ACT Science Data Representation Passage: Drill 3, Problem 5. According to Figure 2, what birth date will be predicted for an individual actual...


