ShmoopTube
Where Monty Python meets your 10th grade teacher.
Search Thousands of Shmoop Videos
Playlist ACT® Science Data Representation 25 videos
ACT Science: Data Representation Passage Drill 1, Problem 1. What do the statistics in Figure 1 suggest?
ACT Science: Data Representation Passage Drill 1, Problem 2. Which of the following is a variable in Figure 1, but not in Figure 2?
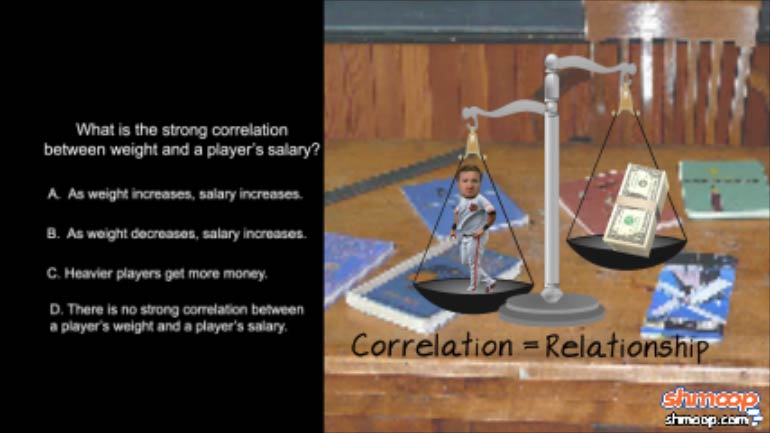
ACT Science: Data Representation Passage Drill 1, Problem 3. What is the strong correlation between weight and a player's salary?
ACT Science 1.4 Data Representation Passage 223 Views
Share It!
Description:
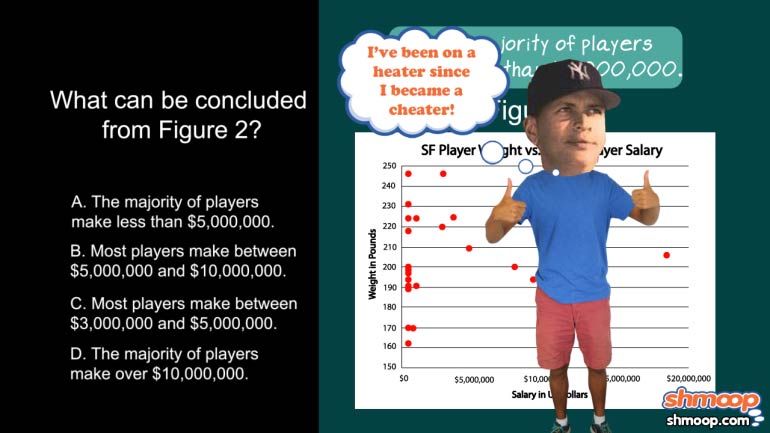
ACT Science: Data Representation Passage Drill 1, Problem 4. What can be concluded from Figure 2?
Transcript
- 00:03
Here's your shmoop du jour, brought to you by player salary.
- 00:07
Sadly, they don't get paid overtime.
- 00:10
What can be concluded from Figure 2?
- 00:17
And here are the potential answers...
- 00:20
This question is asking us what we can conclude
Full Transcript
- 00:22
from figure 2...so let's... look at figure 2.
- 00:25
Yeah, just pass on by figure 1. We couldn't care less about it right now.
- 00:29
All our answer choices are dealing with salary,
- 00:31
so we want to look at those numbers along the bottom...
- 00:34
Ok... our first answer choice states that the majority of players make
- 00:37
less than $5 million bucks.
- 00:39
What? You mean they're not all making A-Rod money? Shocking...
- 00:43
We can check this $5 million figure by looking to see if a majority of the red circles, which
- 00:47
represent each player...
- 00:49
...is between $0 and $5 million in salary, as represented by the x axis of the graph.
- 00:56
Yup. Definitely true. In fact, only 6 players make more than $5 million.
- 01:01
Guess we know who gets stuck with the check when they hit up Applebee's over the weekend.
- 01:05
So yeah...our answer is A. As in "A-Rod paying for Appetizers at Applebees."
Related Videos
ACT Science: Data Representation Passage Drill 1, Problem 1. What do the statistics in Figure 1 suggest?
ACT Science: Data Representation Passage Drill 1, Problem 2. Which of the following is a variable in Figure 1, but not in Figure 2?
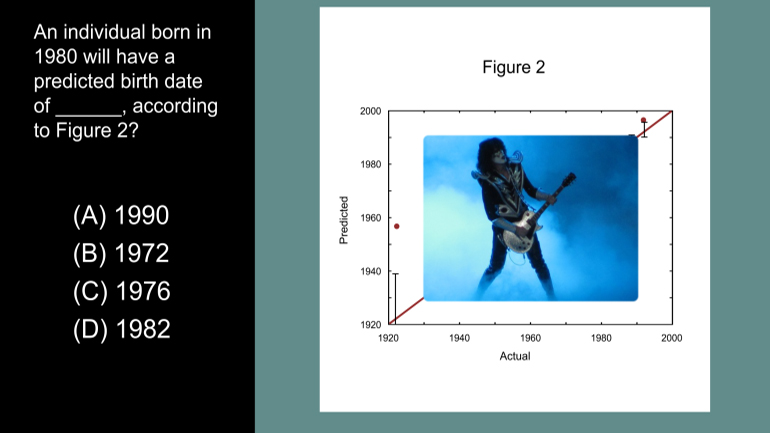
ACT Science Data Representation Passage: Drill 3, Problem 5. According to Figure 2, what birth date will be predicted for an individual actual...
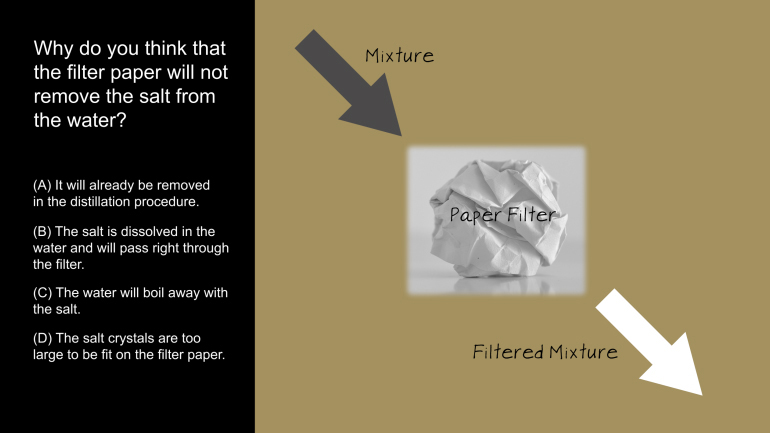
ACT Science: Research Summary Passage Drill 2, Problem 1. Why do you think that the filter paper will not remove the salt from the water?
ACT Science: Conflicting Viewpoint Passage Drill 1, Problem 1. What statement would both scientists agree upon?


