ShmoopTube
Where Monty Python meets your 10th grade teacher.
Search Thousands of Shmoop Videos
Create equations that describe numbers or relationships Videos 4 videos
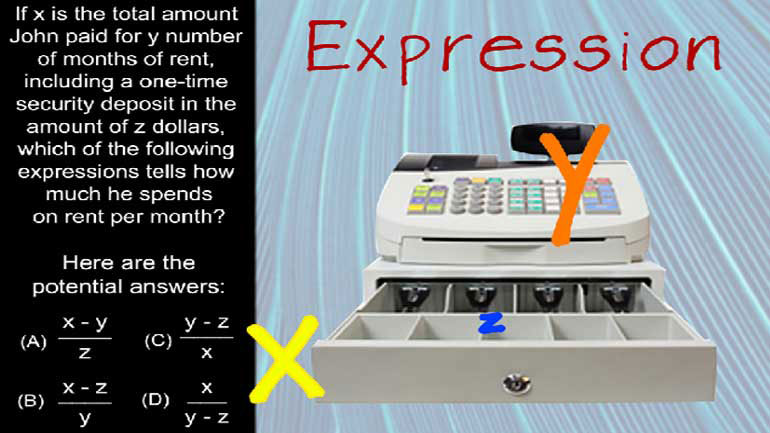
Mathematical Reasoning Drill 2 Problem 4. Which of the following expressions tells how much he spends on rent per month?
Math Algebra I: Drill 5, Problem 4. The following graph represents the solution set to which of the following systems of inequalities in two variab...
CAHSEE Math 5.4 Algebra I 236 Views
Share It!
Description:
Math Algebra I: Drill 5, Problem 4. The following graph represents the solution set to which of the following systems of inequalities in two variables?
- Algebra / Create equations that describe numbers or relationships
- Algebra / Create equations that describe numbers or relationships
- Algebra / Create equations that describe numbers or relationships
- Algebra / Create equations that describe numbers or relationships
- Algebra / Create equations that describe numbers or relationships
- Algebra I / Equations of lines
Transcript
- 00:03
Here's another shmoop du jour.
- 00:04
The following graph represents the solution set to which of the following systems of inequalities in two variables?
- 00:11
Here are the potential answers…
- 00:17
Ok sooo… what in the world is a solution set, first of all?
- 00:21
Well, it’s the set of all points that answers a given equation.
Full Transcript
- 00:25
Like… if the inequalty was “x is greater than 0,” then the whole right side of a
- 00:29
graph would be shaded in like this…
- 00:31
From the graph, we can see that one line is dotted, while the other is solid.
- 00:35
We know that a “less than” or “greater than” inequality without the “equals to”
- 00:40
signifies a dotted line…
- 00:42
…and that a “less than or equal to” and a “greater than or equal to” inequality
- 00:45
signifies a solid line.
- 00:48
So, because we have one of each in our graph, we know our answer solution has to have one
- 00:52
inequality with an equals sign and one without.
- 00:56
We can immediately eliminate A and D.
- 00:58
The dotted line has the equation y equals -x + 3, and in the graph, the shaded region
- 01:04
is above this line.
- 01:06
So we know the inequality must be “y is GREATER THAN negative x plus 3.”
- 01:10
Only B has this inequality, and we're good.
- 01:14
That's it. Answer B.
Related Videos
CAHSEE Math: Algebra and Functions Drill 5, Problem 3. Solve the equation.
You don't want to leave a bunch of unsolved rational equations sitting around.
Solving inequalities using blob fish? Yes, please!
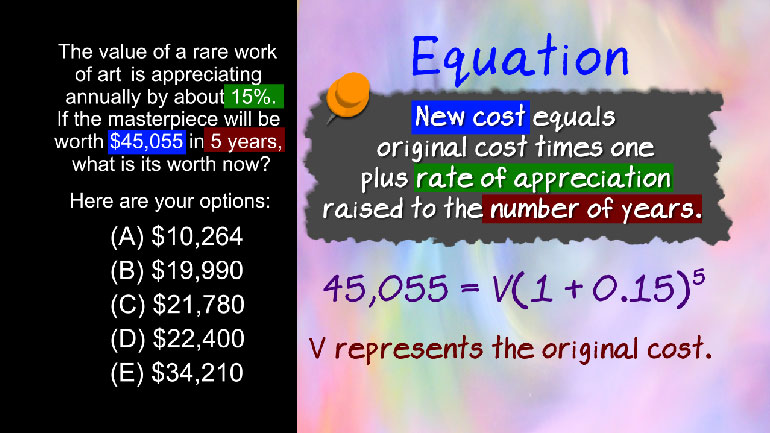
SAT Math: Numbers and Operations Drill 1, Problem 2. If the masterpiece will be worth $45,055 in five years, what is its worth now?


