ShmoopTube
Where Monty Python meets your 10th grade teacher.
Search Thousands of Shmoop Videos
Statistics and Probability Videos 14 videos
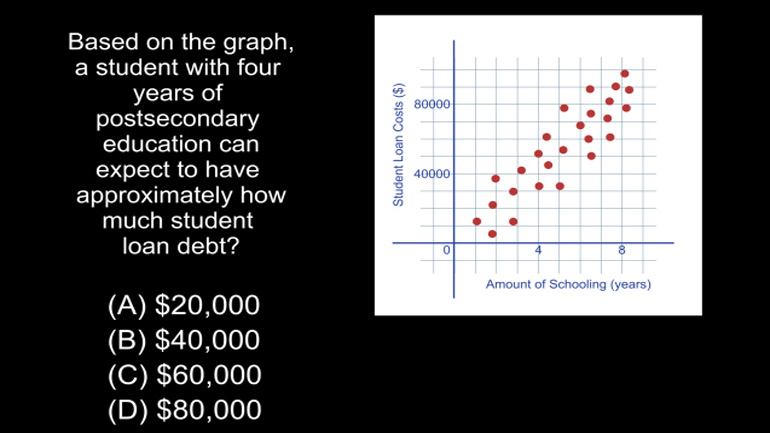
Statistics, Data, and Probability II Drill 4 Problem 4. Based on the graph, a student with four years of postsecondary education can expect to...
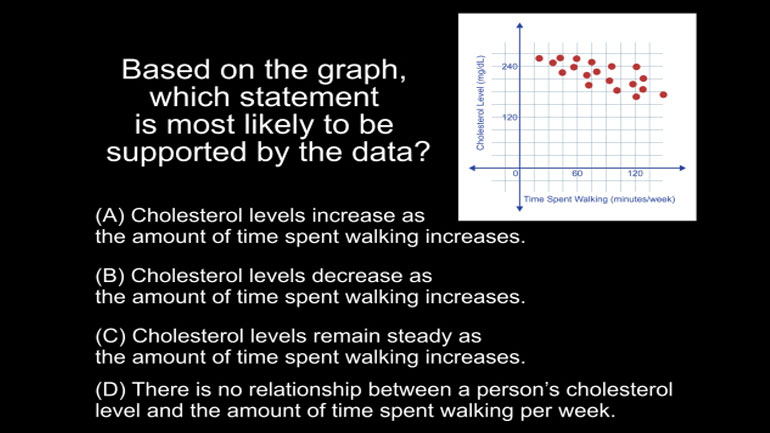
Statistics, Data, and Probability II Drill 4 Problem 3. Based on this graph, a person who walks about 2.5 hours per week can expect to have a...
CAHSEE Math 5.2 Statistics, Data, and Probability II 176 Views
Share It!
Description:
Statistics, Data, and Probability II Drill 5 Problem 2. Based on this data, a student who had missed 10 days of school can expect his GPA to be about what?
Transcript
- 00:03
Here’s your shmoop du jour...
- 00:05
Edgar, student at Duh University, has made a shocking, controversial claim –
- 00:10
that more time spent in school means better grades.
- 00:15
He may just be a student by day, but by night… Edgar is… CAPTAIN OBVIOUS!
- 00:21
Anyway, he conducted a survey asking students about the number of days that they were absent
Full Transcript
- 00:25
in a semester, and their semester GPAs were. The results are shown in the plot below.
- 00:30
Based on this, a student who had missed 10 days of school can expect his GPA to be about…what?
- 00:37
And here are the potential answers...
- 00:42
OK, so this question is testing whether we
- 00:44
know the difference between positive and negative correlations.
- 00:48
The basic idea is that if elements are positively correlated, they generally head in the same direction.
- 00:54
So... given NO OTHER DATA, if we just looked at this scatter plot of points, we’d surmise
- 01:00
that they generally drift south as we move to the right.
- 01:03
There is a clear ‘directionality’ to them. So we've got absences on one side and GPA on the other.
- 01:09
How much are they alike?
- 01:10
As we get higher in absences we have a LOWER grade point average – so in this case it’s
- 01:15
a pretty clear NEGATIVE correlation.
- 01:17
That is – more absences means lower grades.
- 01:21
If it had been more absences means HIGHER grades, we’d have the dots gradually sloping
- 01:26
UP instead of down… …and we’d have a whole lot fewer kids in school.
- 01:30
The answer is B.
- 01:32
As in… “Brains don’t work that way.”
Related Videos
CAHSEE Math: Algebra and Functions Drill 5, Problem 3. Solve the equation.
Statistics, Data, and Probability I: Drill Set 3, Problem 4. How many different avatars can be created based on the given options?
Statistics, Data, and Probability II Drill 3 Problem 2. Which two sports together make up for the preferences of more than half of all those w...
Statistics, Data, and Probability II Drill 3 Problem 3. One hundred twenty of those who were asked preferred what sport?
