ShmoopTube
Where Monty Python meets your 10th grade teacher.
Search Thousands of Shmoop Videos
Summarize, represent, and interpret data on a single variable Videos 5 videos
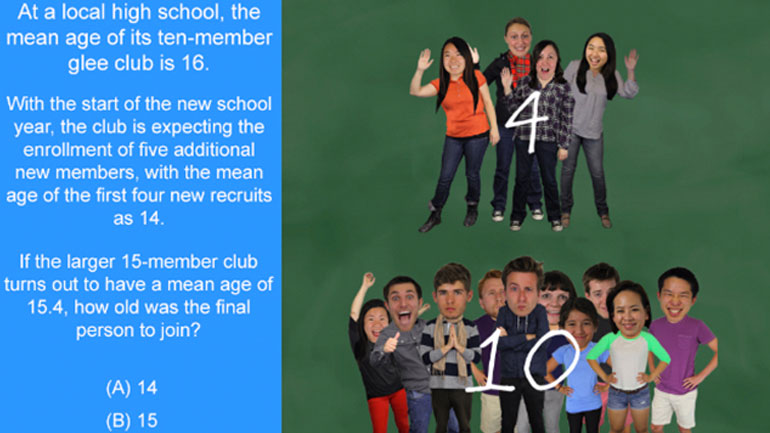
Statistics, Data, and Probability I: Drill Set 1, Problem 4. How old was the final person to join?
Data doesn't do us much good if we can't interpret it. Ever snuck into a CPA's office while he slips out for a coffee break and tried to decipher o...
CAHSEE Math 1.5 Statistics, Data, and Probability I 234 Views
Share It!
Description:
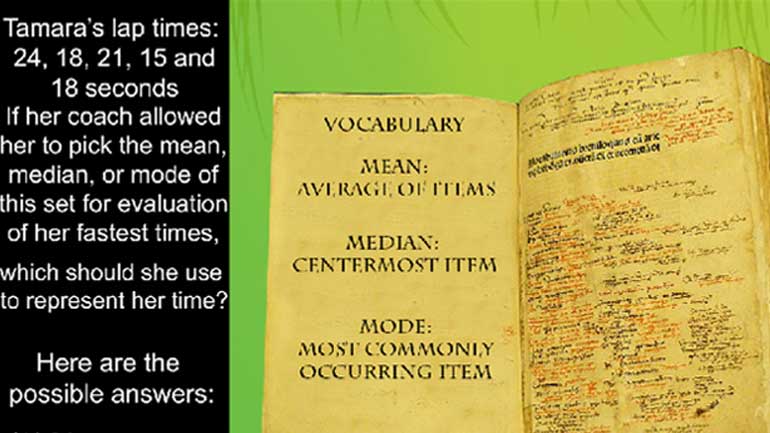
Statistics, Data, and Probability I: Drill Set 1, Problem 5. Which should be used to represent her time?
- Statistics and Probability / Summarize, represent, and interpret data on a single variable
- Statistics and Probability / Summarize, represent, and interpret data on a single variable
- Statistics and Probability / Summarize, represent, and interpret data on a single variable
- Statistics and Probability / Summarize, represent, and interpret data on a single variable
- Statistics, Data Analysis, and Probability 6 / Statistical data
Transcript
- 00:03
Okay, let's get down to the shmoopy question.
- 00:06
Tamara, a runner in her high school track team, posted lap times of 24, 18, 21, 15,
- 00:13
and 18 seconds on her practice runs.
- 00:15
If her coach allowed her to pick the mean, median, or mode of this set for evaluation
- 00:20
of her fastest times, which should she use to represent her time?
Full Transcript
- 00:26
Here are the possible answers:
- 00:33
Clearly Tamara needs to work on her pacing.
- 00:35
Like... come on... a 15 second lap and a 24 seconder?
- 00:38
What is she... downing Big Macs between laps?
- 00:41
Okay... now what's this... semi-weird question asking?
- 00:44
Well, 3 things, really... all involving vocab words we have to know:
- 00:49
That's mean... median... and mode.
- 00:52
And there's a curve ball thrown in here...
- 00:54
in that we want the lowest number...
- 00:57
The lowest number represents the shortest time it took Tammy-pie to run her lap.
- 01:02
Smaller is better.
- 01:04
So there are 3 parts to this problem.
- 01:07
First, we calculate the mean or average... which is:
- 01:10
24 + 18 + 21 + 15 + 18, which totals 96.
- 01:15
Divide the 96 by 5, since we're averaging 5 elements...
- 01:19
...and we get 19.2 as the mean.
- 01:22
So Tamara's mean time based on this assessment of her fine athletic field efforts is 19.2.
- 01:27
We're a third of the way there. Second, we calculate the median.
- 01:31
Median is just a fancy way of saying "the middle."
- 01:34
Once we order the numbers from smallest to biggest...
- 01:38
...we can see that the middle number is 18.
- 01:41
So the median has beaten out the mean by 1.2 seconds.
- 01:45
But we have a third calculation we need to apply... mode.
- 01:49
In other words, what number occurs most frequently?
- 01:52
Doesn't matter how big it is. For example, if we're looking for the mode among 99,
- 01:56
98, 97, 96, 2 and 2...
- 01:58
Our mode is 2. Score one for the little guy. Right. So what's the mode here? 18.
- 02:05
It appears we have a tie.
- 02:07
Median and mode... going to sudden death...
- 02:09
So the answer is D, "either"...
- 02:12
...that is, the median and mode are both 18.
Related Videos
CAHSEE Math: Algebra and Functions Drill 5, Problem 3. Solve the equation.
Statistics, Data, and Probability I: Drill Set 3, Problem 4. How many different avatars can be created based on the given options?
Statistics, Data, and Probability II Drill 3 Problem 2. Which two sports together make up for the preferences of more than half of all those w...
Statistics, Data, and Probability II Drill 3 Problem 3. One hundred twenty of those who were asked preferred what sport?


