ShmoopTube
Where Monty Python meets your 10th grade teacher.
Search Thousands of Shmoop Videos
Methods of Data Collection Videos 4 videos
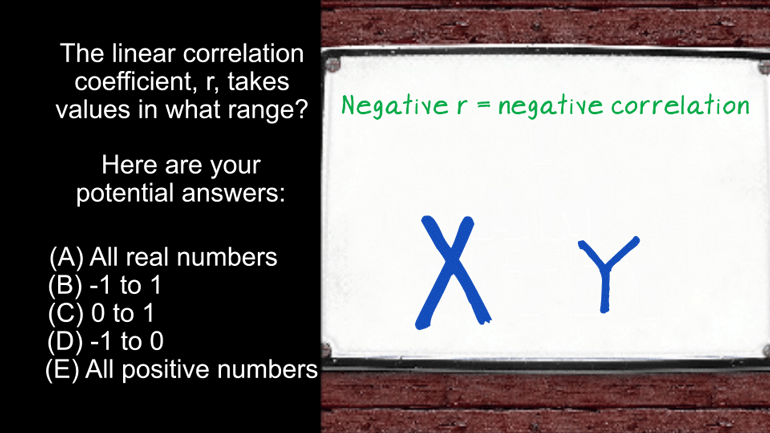
AP Statistics 4.2 Exploring Data. The linear correlation coefficient r, takes values in what range?
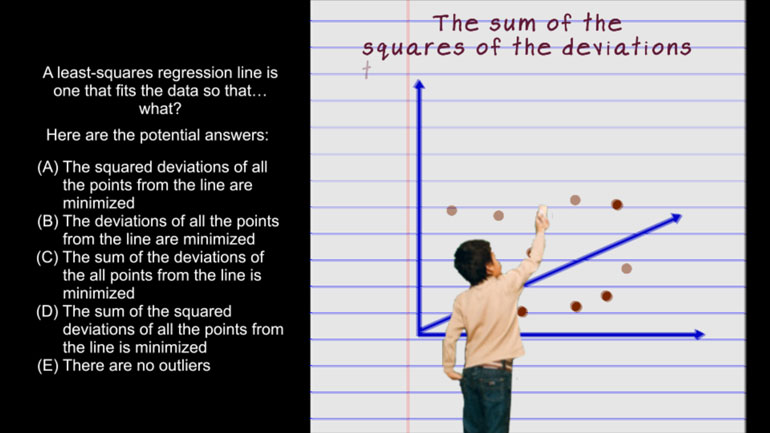
AP Statistics 4.1 Exploring Data. A least-squares regression line is one that fits the data so that...what?
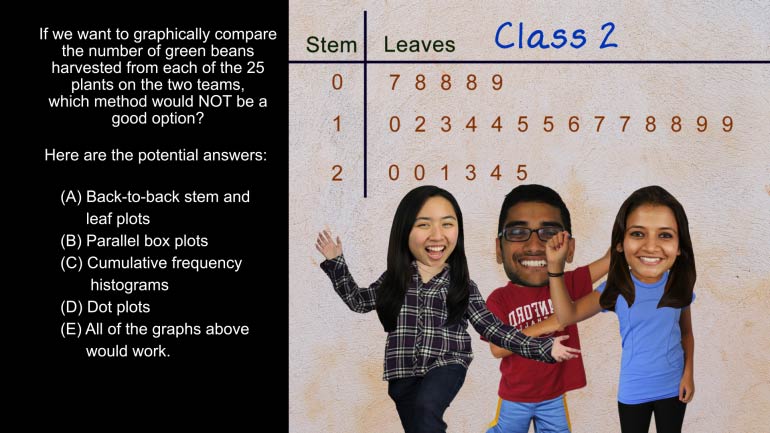
AP Statistics 5.2 Exploring Data. Which method would not be a good option?
AP Statistics 2.5 Statistical Inference 180 Views
Share It!
Description:
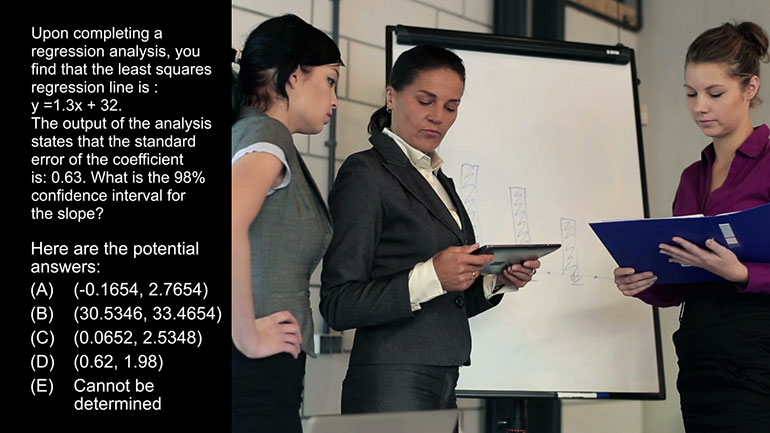
AP Statistics 2.5 Statistical Inference. What is the 98% confidence interval for the slope?
Transcript
- 00:00
Thank you We sneak And his you're shmoop du jour
- 00:06
brought to you by regression You know that feeling you
- 00:09
get when your mathematical skills suddenly go from i'm pretty
- 00:12
sure tio if i'm completing a regression analysis you find
- 00:18
that the least squares regression line is why equals one
Full Transcript
- 00:22
point three Acts plus 32 The output of the analysis
- 00:25
states that the standard bearer of the coefficient is point
- 00:28
six three Well knowing this what is the ninety eight
- 00:31
percent confidence interval for the slope And here the potential
- 00:34
answers One day you may find yourself running your own
- 00:41
business looking down at the rest of us from the
- 00:43
windows of your fifty fourth floor corner office you'll find
- 00:46
it advantageous to have your staff of accountants use regression
- 00:50
analysis to identify the factors responsible for your corporation's profits
- 00:54
Okay so that might be twenty thirty years away but
- 00:56
well there's no time like the present now that we
- 00:59
have the least squares regression line and we know the
- 01:01
standard air of the coefficient is point six three we
- 01:04
can easily calculate the ninety eight percent confidence interval for
- 01:08
the slope Well they are absolutely correct We need a
- 01:12
sample size and we don't have one without that vital
- 01:15
info We can't calculate the t value because we need
- 01:19
to know the degrees of freedom You know statistics are
- 01:22
stubborn that way so you can attempt to make any
- 01:25
of the answers a through d work but you're going
- 01:27
to experience an epic fail The answer is e it
- 01:31
can't be determined that's the right answer in the world
- 01:34
of statistical inference numbers air like ants they need each 00:01:38.491 --> [endTime] other to solve problems especially on a slope
Related Videos
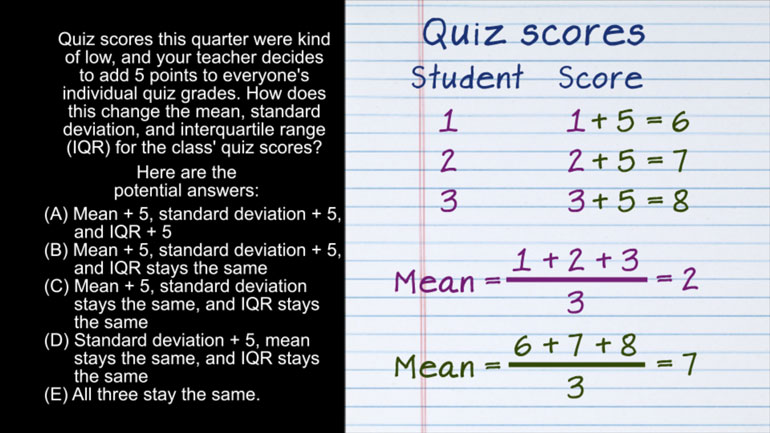
AP Statistics 2.1 Exploring Data. How does this change affect the mean, standard deviation, and IQR?
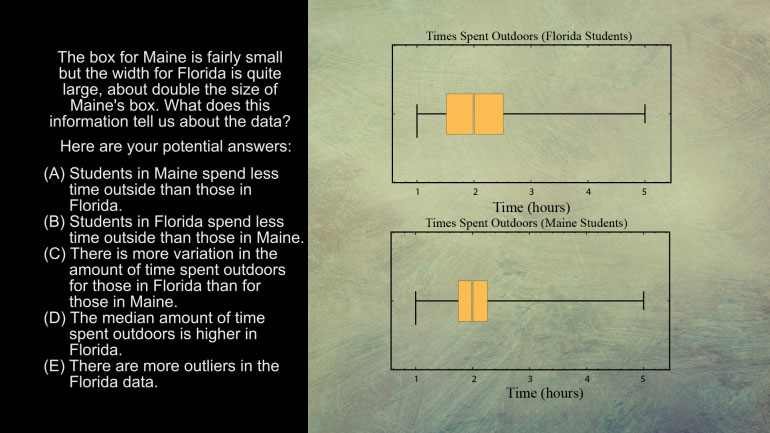
AP Statistics 5.1 Exploring Data. What does this information tell us about the data?
AP Statistics 5.2 Exploring Data. Which method would not be a good option?
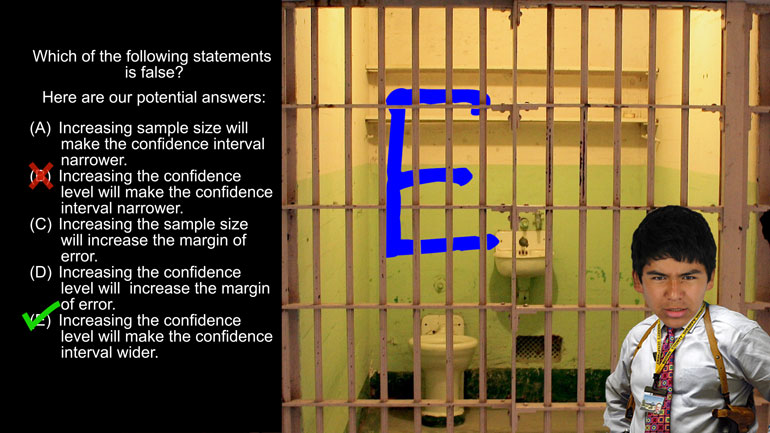
AP Statistics 1.5 Statistical Inference. Which of the following statements is false?
Want to pull an Oliver Twist and ask us for more? We've gotcha covered. Head over to /video/subjects/math/test-prep/ap-statistics/ for more AP...
