ShmoopTube
Where Monty Python meets your 10th grade teacher.
Search Thousands of Shmoop Videos
Make inferences and justify conclusions Videos 5 videos
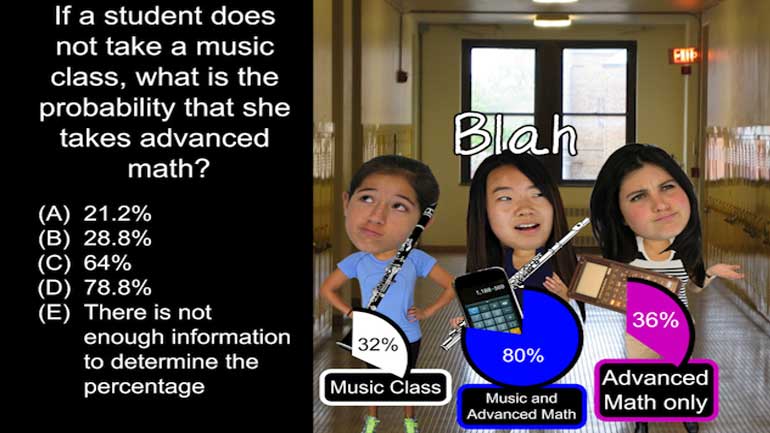
AP Statistics: Anticipating Patterns Drill 1, Problem 2. If a student does not take a music class, what is the probability that she takes adva...
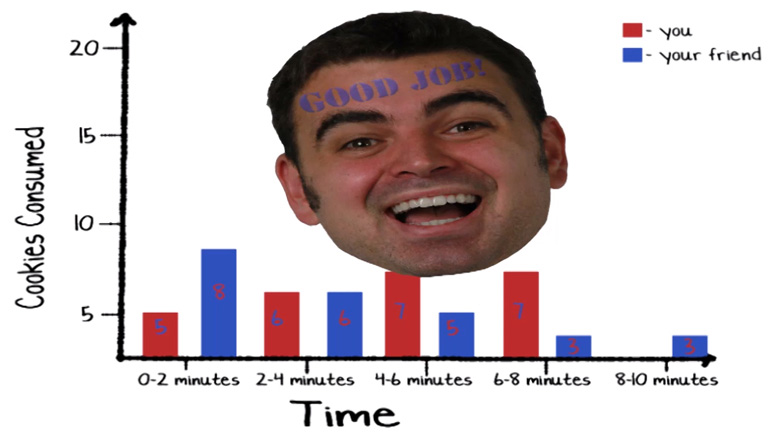
Data doesn't do us much good if we can't interpret it. Ever snuck into a CPA's office while he slips out for a coffee break and tried to decipher o...
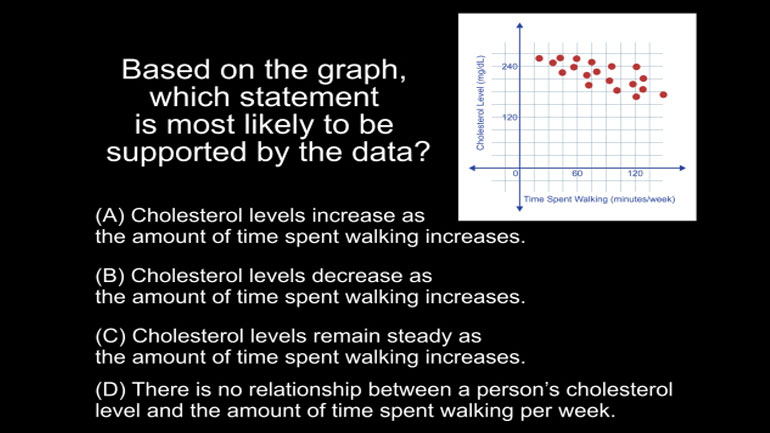
Statistics, Data, and Probability II Drill 4 Problem 2. Based on the graph, which statement is most likely to be supported by the data?
AP Statistics 1.2 Anticipating Patterns 349 Views
Share It!
Description:
AP Statistics: Anticipating Patterns Drill 1, Problem 2. If a student does not take a music class, what is the probability that she takes advanced math?
Transcript
- 00:03
Here's an unshmoopy question you'll find on an exam somewhere in life...
- 00:11
At Washington High School, 32% of students take a music class.
- 00:15
80% of students who take music also take an advanced math course.
- 00:20
36% of the students in the math course do not take a music class.
- 00:24
If a student does not take a music class,
Full Transcript
- 00:27
what is the probability that she takes advanced math?
- 00:30
And here are the possible answers...
- 00:36
Blah, blah, blah. So many percentages in this question...and they didn't bother to just
- 00:41
calculate one more? Fine... WE'LL do it... The questions asks us: if a student does NOT
- 00:47
take a music class, what's the probability that she takes advanced math?
- 00:52
How should we write that in probability notation?
- 00:55
We're looking for the probability that a
- 00:57
student is in math GIVEN THAT she's not in music.
- 01:01
We represent a "given statement" with
- 01:03
a straight vertical bar...like this... Great, so now we've written the probability
- 01:09
that she takes math given that she doesn't take music.
- 01:12
Think back to the conditional probability formulas you should have memorized... the
- 01:16
probability of B given A equals the probability of A and B divided by the probability of A.
- 01:24
Translating this to the variables math and music....we have to find the probability of
- 01:28
no music AND math... which is just the probability of taking ONLY math and dividing it by the
- 01:34
probability of just math. All right, keep these in mind. We'll need
- 01:38
these values in order to find what we want.
- 01:44
You know those diagrams our teacher made us
- 01:45
draw to analyze the similarities and differences between two things... Venn diagrams?
- 01:52
Well, we can use a Venn diagram here to show the number of students taking math, the number
- 01:57
of students taking music, and the overachievers who are taking both.
- 02:03
Labeling the left side with math and the right side with music... the first thing we're given
- 02:07
is that 32% of students take a music class. We can indicate this by labeling the entire
- 02:12
music circle "32%." The next statement we're given is that 80%
- 02:17
of students who take music also take an advanced math course. This is equivalent to saying
- 02:22
that the probability of a student taking math GIVEN THAT they take music is 80%.
- 02:29
Using the conditional probability rule, we can just multiply .8 times .32 to get the
- 02:34
probability of students that take music AND math.
- 02:37
So we have .8 times .32 is .256...or 25.6%.
- 02:43
Finally, we're given that 36% of the students
- 02:46
in the math course do not take a music class. So .36 times P(math) is the shaded left region
- 02:53
of the math circle, not including the intersection of math and music.
- 02:58
BUT we just solved for the intersection of math and music as .256...so we know the complement
- 03:03
of .36 times the probability of math is .64 times the probability of math.
- 03:11
Setting the two equal, we get that .64 times the probability of math equals .256.
- 03:16
Divide both sides by .64, and the probability of taking math is... 40 percent.
- 03:22
We figured out earlier that .36 times P(math) was the probability of students that ONLY
- 03:27
take math...so now that we have that value,
- 03:31
we can just multiply .36 times .4... to get .144. PHEW.
- 03:36
Ok, now back to the formula we set in
- 03:39
the very, very beginning,
- 03:44
about oh... three hours ago... and plugging in our values...
- 03:47
.144 divided by .68 equals around .212.
- 03:52
The best option is choice (A), or 21.2%.
- 03:56
And that is music... or math... to our ears.
Related Videos
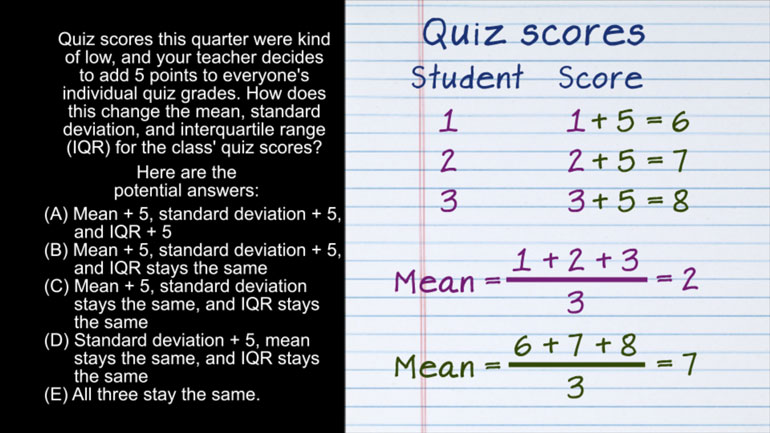
AP Statistics 2.1 Exploring Data. How does this change affect the mean, standard deviation, and IQR?
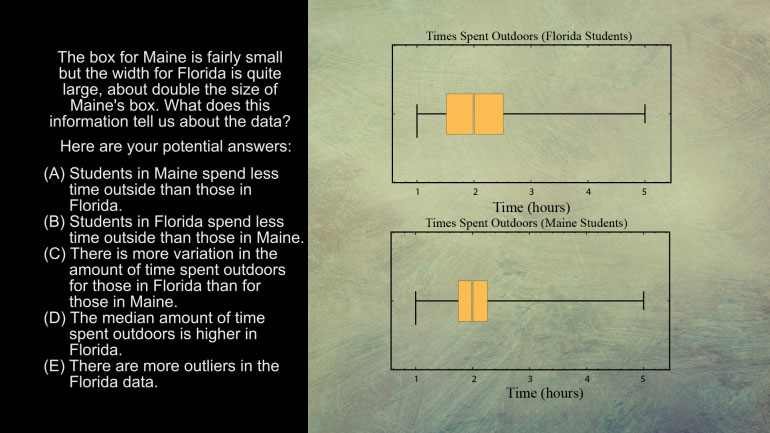
AP Statistics 5.1 Exploring Data. What does this information tell us about the data?
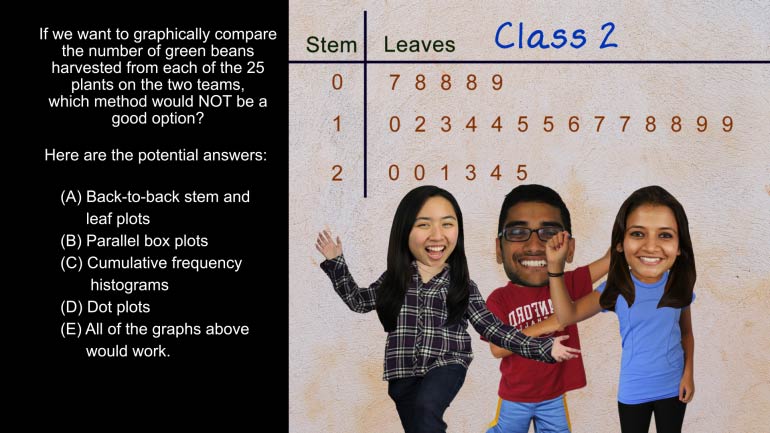
AP Statistics 5.2 Exploring Data. Which method would not be a good option?
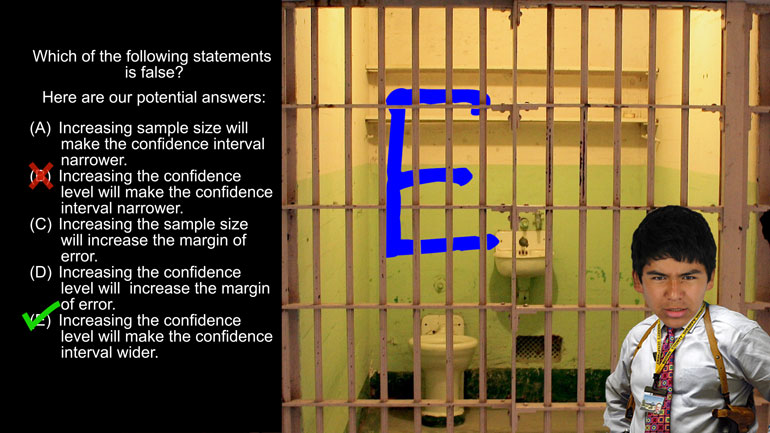
AP Statistics 1.5 Statistical Inference. Which of the following statements is false?
Want to pull an Oliver Twist and ask us for more? We've gotcha covered. Head over to /video/subjects/math/test-prep/ap-statistics/ for more AP...
