ShmoopTube
Where Monty Python meets your 10th grade teacher.
Search Thousands of Shmoop Videos
Informational Videos 41 videos


ACT Reading 1.4 Social Science Passage. Which of the following best describes the main idea of this passage?
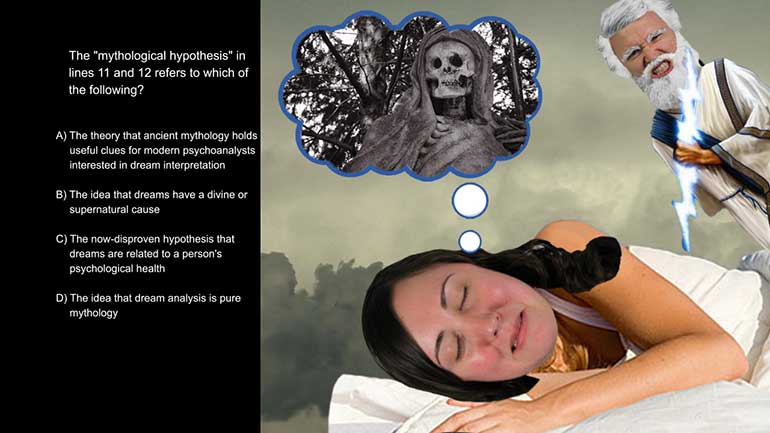
ACT Reading 1.8 Social Science Passage. The "mythological hypothesis" in lines 11 and 12 refers to which of the following?

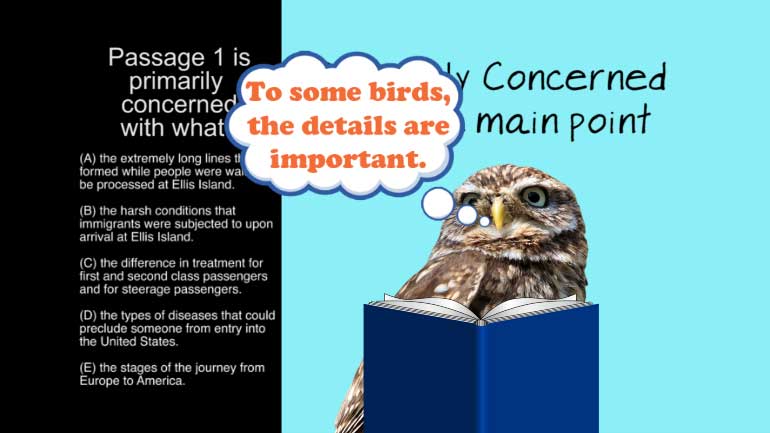
ACT Reading: Social Science Passage Drill 1, Problem 10. The intended audience for this passage was most likely which of the following?
Birth Year Predictions 217 Views
Share It!
Description:
ACT Science: Data Representation Passage Drill 3, Problem 2. After what year in the graph is the scientist's model most accurate at predicting birth year?
Transcript
- 00:03
Here’s your shmoop du jour, brought to you by birth predictions.
- 00:06
For example, we totally predicted that you'd be born.
- 00:09
Yeah, we called it.
- 00:11
After what year in the graph is the scientist's model most accurate at predicting birth year?
- 00:16
And here are the potential answers...
Full Transcript
- 00:20
Okay, so which graph is
- 00:22
hitting the nail on the head when it comes to birth year.
- 00:25
Figure 1 shows that the amount of carbon-14 (14C) in an individual's eye related to the
- 00:29
amount of 14C in the atmosphere at the time of that individual's birth.
- 00:33
That’s not the one we want at all.
- 00:35
So we should refer to figure 2, because the question is asking about predicting birth year.
- 00:40
Figure 2 just happens to be all about predictions.
- 00:43
The perfectly diagonal red line shows the ideal 1:1 ratio between the predicted and
- 00:47
actual years of birth. In other words, the dots would be on that red line if the scientists
- 00:53
were psychics and could predict the patients’ actual years of birth.
- 00:58
For this question, we’re interested in which red dots are closest to this red line.
- 01:03
After 1960, the dots seem to hug the line pretty closely,
- 01:07
but before 1960, they are relatively far away.
- 01:15
Guess the dots and the lines saw a couple’s therapist to work out their problems.
- 01:21
Since the dots are closest to the line only after 1960,
- 01:24
the model is most accurate at making predictions after 1960.
- 01:28
So our answer’s C.
Related Videos
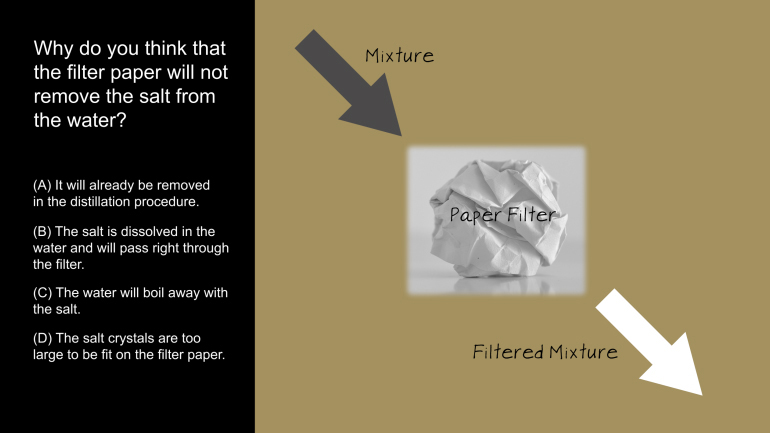
ACT Science: Research Summary Passage Drill 2, Problem 1. Why do you think that the filter paper will not remove the salt from the water?
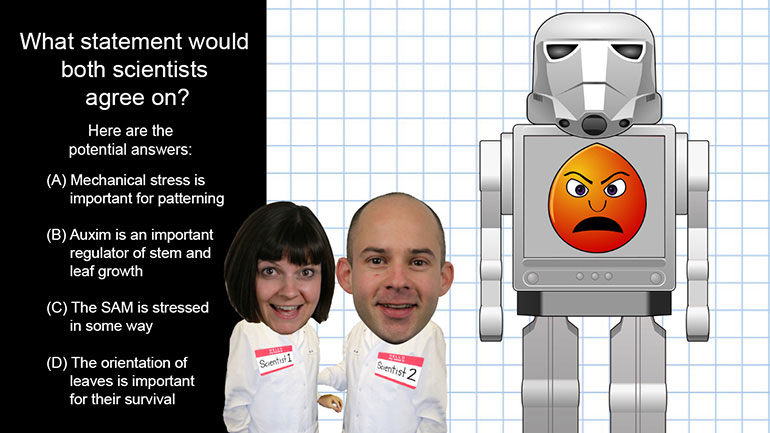
ACT Science: Conflicting Viewpoint Passage Drill 1, Problem 1. What statement would both scientists agree upon?

ACT Science: Data Representation Passage Drill 1, Problem 1. What do the statistics in Figure 1 suggest?

ACT Science: Data Representation Passage Drill 1, Problem 2. Which of the following is a variable in Figure 1, but not in Figure 2?
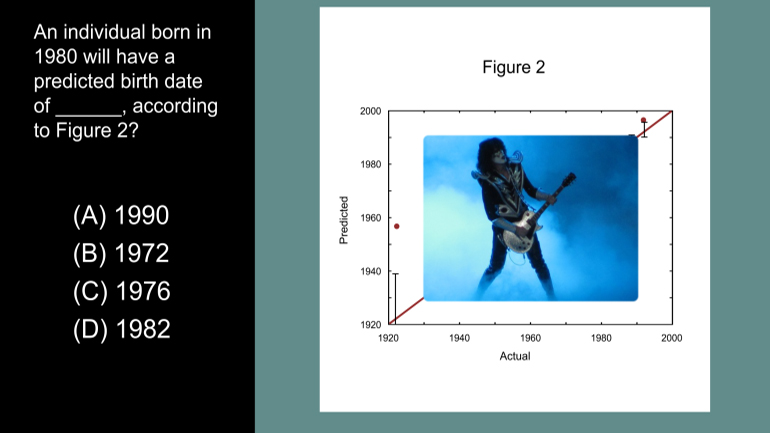
ACT Science Data Representation Passage: Drill 3, Problem 5. According to Figure 2, what birth date will be predicted for an individual actual...