ShmoopTube
Where Monty Python meets your 10th grade teacher.
Search Thousands of Shmoop Videos
Data Representation Videos 15 videos
According to the data, the most sharks were recorded on:
According to the information in Table 1, what was the wind direction and wind speed during the feeding event that included the largest whale?
Based on Table 1, which wind direction had the highest total number of sharks?
ACT Aspire Science: Reading Rock Formations in Tables 0 Views
Share It!
Description:
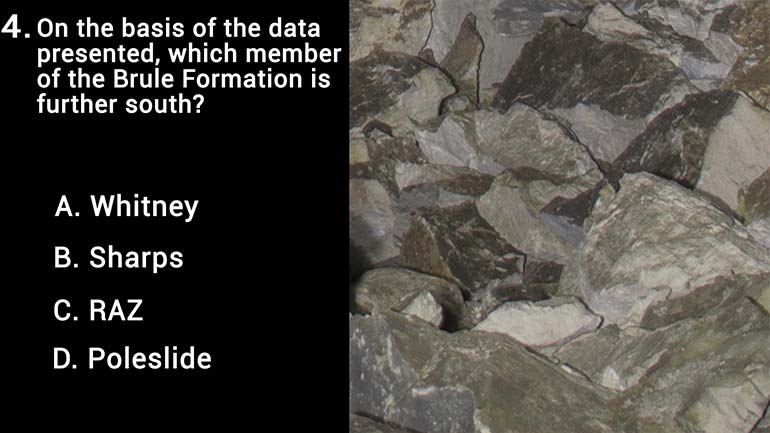
On the basis of the data presented, which member of the Brule Formation is further south?
Transcript
- 00:00
Yeah Oh okay People More aspiring science figure One thing
- 00:09
right here shows the strata Graphic relationships of some of
- 00:13
the great Plains formations Strata graphic columns show older rocks
- 00:17
the bottom and younger rock units toward the top going
- 00:21
right there All right so here it is That's the
Full Transcript
- 00:23
data representing you on all the crap is study Okay
- 00:27
And they can kind of skim all this stuff if
- 00:29
you need Teo Here we go On the basis of
- 00:36
the data presented which member of the Brule formation is
- 00:40
further south through information Gonna find that on the map
- 00:44
here in second Well time to hit rock bottom Here
- 00:49
We're dealing with the lowest part of the figures that
- 00:51
rule formation You say that with a mouthful of marbles
- 00:54
All right tilt your head to the left You'll see
- 00:56
that the Brule formation has two members poolside and Whitney
- 00:59
The sharp information is clearly distinguish from the rule formation
- 01:03
Be right there with the Raz sandwiched between him as
- 01:07
in see right there so we can exclude those from
- 01:10
consideration right off the bat Now how do we know
- 01:13
which one is further south The Whitney or the pole
- 01:16
side Well if you can't remember where South Dakota is
- 01:19
relative to Nebraska you can look further up to see
- 01:22
that the labels for directions are given at the top
- 01:25
of the figure And we must say we really bounce
- 01:28
right back up there after hitting our all time low
- 01:30
Yeah well the geologic units and features on the right
- 01:34
hand side of this column are farther south than those
- 01:37
on the left hand side Therefore the Whitney member is
- 01:40
the correct answer So yeah it's just a That's it
- 01:44
for Whitney Whitney and wit need with it Never mind
Related Videos
According to the data, the most sharks were recorded on:
According to the information in Table 1, what was the wind direction and wind speed during the feeding event that included the largest whale?
Based on Table 1, which wind direction had the highest total number of sharks?
According to the information in Figure 1, what is the maximum shark size for a wind speed of ~18 knots?
Based on the information in Figure 1, which of the following best describes the linear regression applied to the data for maximum shark size versus...
